Churn Analytics: from data analysis to Machine learning
Churn Analytics: Data Analysis to Machine learning

Customer is one of the most precious resources in any business, acquiring clients can time consuming and expensive. Retaining the most profitable clients can be one of the best strategies businesses can have. Identifying the clients before they leave would be crucial. that’s were the churn analysis comes very handy in the Data Science.
The business or organizations are interested in know the cluster/segment/group of the clients who is like to leave. retention is more cost-effective than acquiring a new customer. there is always a cost & risk involved in acquiring a new client. here is an example of churn analytics & Applied Machine Learning on a banking client dataset.
Data
The dataset comes from the Kaggle, and it is related to European banking clients of counties like France, Germany, and Spain. The classification goal is to predict whether the client will churn (1) or stay (0). The dataset can be downloaded from here.
Input Variables
RowNumber: each row consist of one client information (numeric)
CustomerId: unique identifier for customers (numeric)
Surname: last name of the client (categorical)
CreditScore: Credit score of the client(numeric)
Geography: the territory of the customers (categorical)
Gender: male or female (categorical)
Age: age of the client (numeric)
Tenure: the time with the bank as a client (numeric)
Balance: balance (numeric)
NumOfProducts: How many accounts, bank account affiliated products the person has (numeric)
HasCrCard: the person has a credit card or not (categorical)
IsActiveMember: active product user with transaction vs no activity or transaction (categorical)
EstimatedSalary: estimated salary income or each client (numeric)
Exited: attrition, Did they leave the bank after all? Yes (1), No (0) (categorical)
Predict variable (desired target):
Exited Yes (1)— has the client churned? (binary: “1”, means “Yes”, “0” means “No”)
Data Preprocessing
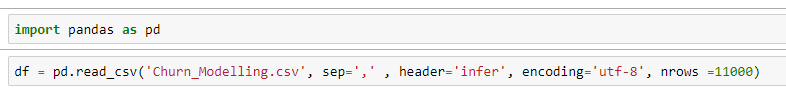
I have used pandas for data preprocessing, the data set came with column labels and each row represents single client data. In terms of missing values or duplicates (a rare case in real-world data) came pretty clean.
besides python, pandas, and sk-learn, Cloud AWS S3, EC2, Linux, Excel & Tableau public is being used for this end to end project
AWS Steps:
- Start an EC2 instance, install all relevant libs with anaconda distribution & Jupyter notebook (use Linux CentOS)
- Open S3 bucket
- Export the Data to S3
- Mount Data on EC2
- Clean, Explore Analyse, model the data using Python
- Connect Tableau to S3 for Dashboarding and Reporting/ alternatively AWS Quicksight can be used
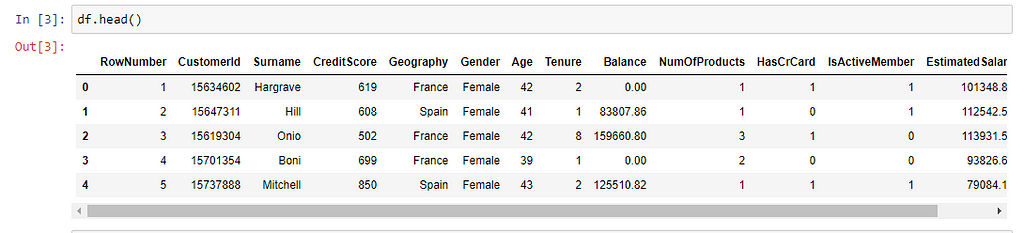
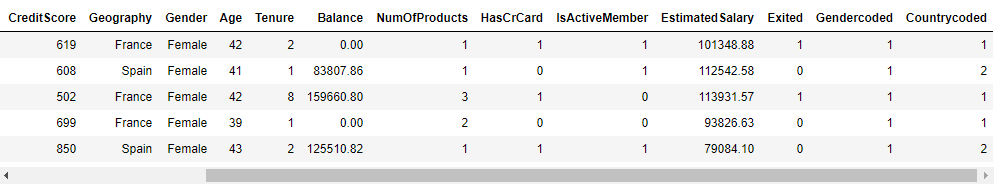
Pandas Dataframe
Snapshot of the Data
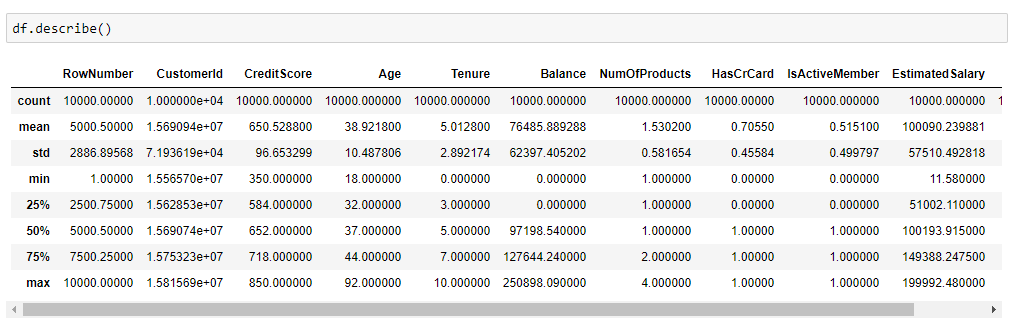
Statistical Summary
Feature Engineering:
Finding Correlated Features
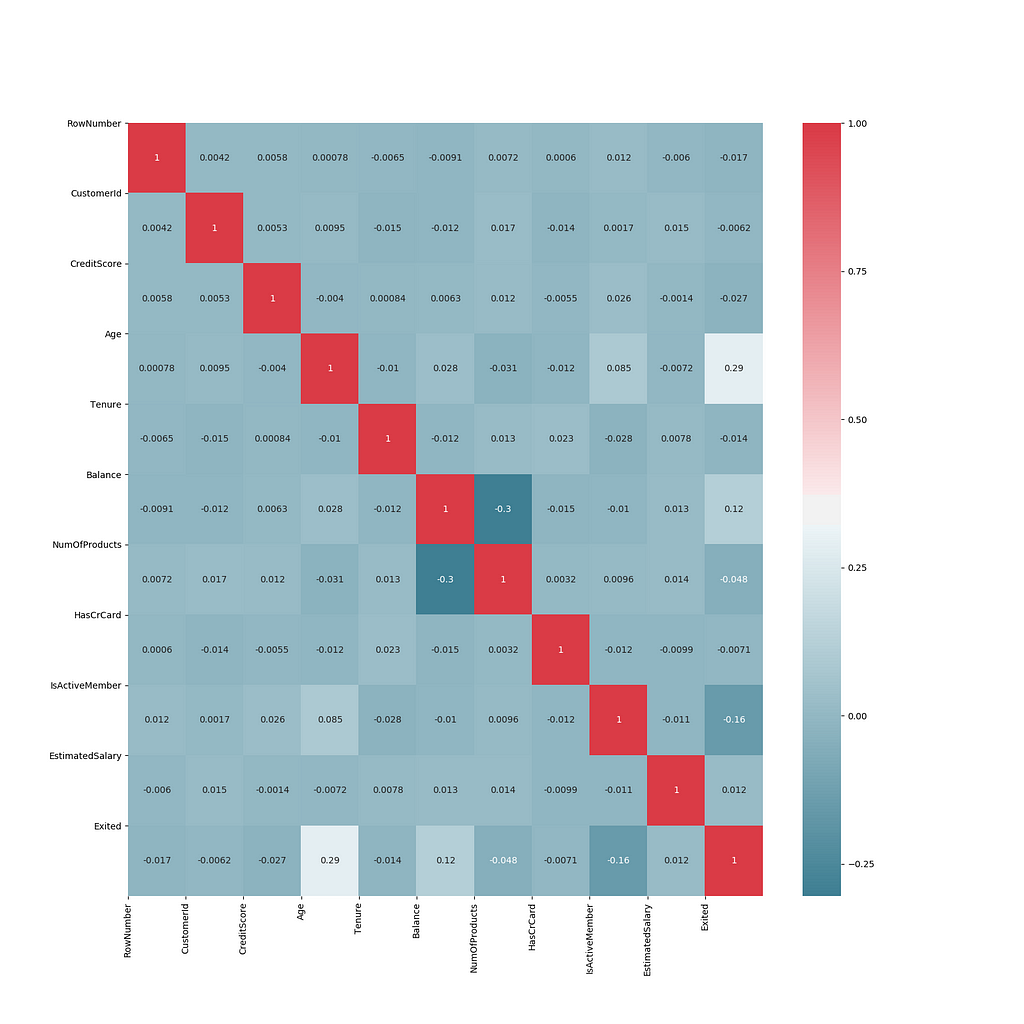
It shows that none of the features are highly correlated with each other
Some of the features Geography, Gender, Surname came of as pandas object, some rowNumber, CustomerId, Creditscore, Age, Tenure, NumOfProducts, HasCrCard, IsActiveMember came as an integer. those columns need to be feature engineered for machine learning. Transformed objects & int features into floats & also created new encoded features for Geography, Gender.
Insights & Analytics:
Here are some of the Insights drawn from the dataset (using Tableau public)
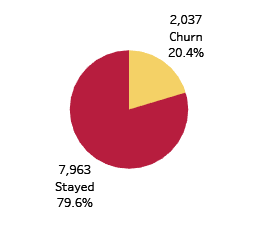
- The proportion of Churn to Non-Churn
20% Churn /Attrition
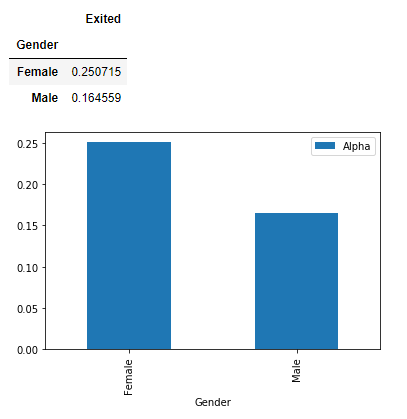
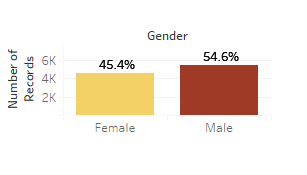
2. Gender Proportion to Churn
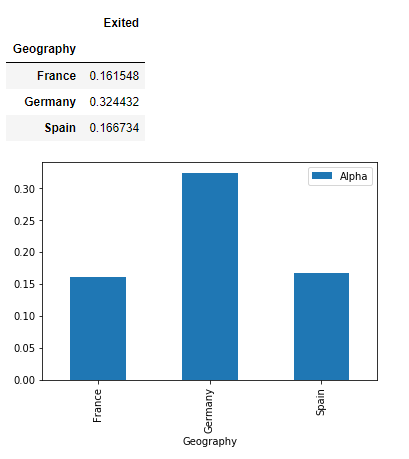
3. Countrywise churn
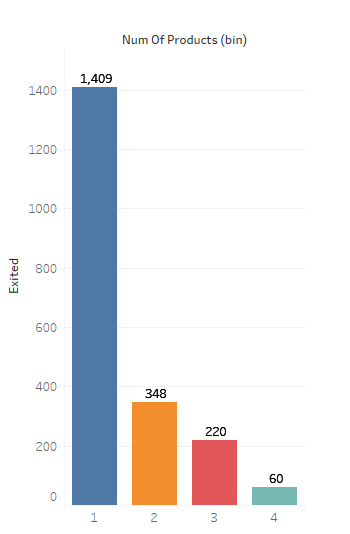
4. Does the Number of Products affect Churn?
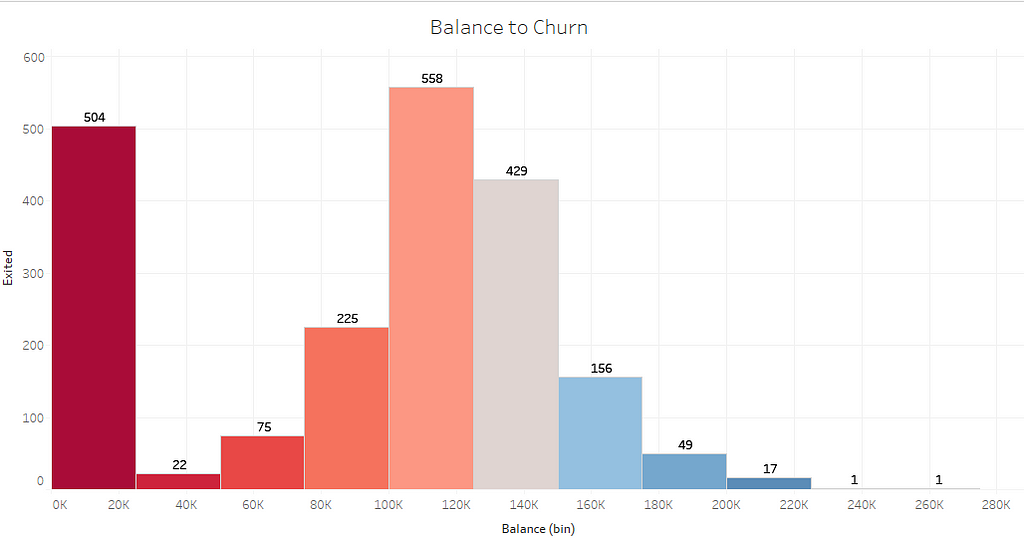
5. Does the Balance have any influence on Churn?
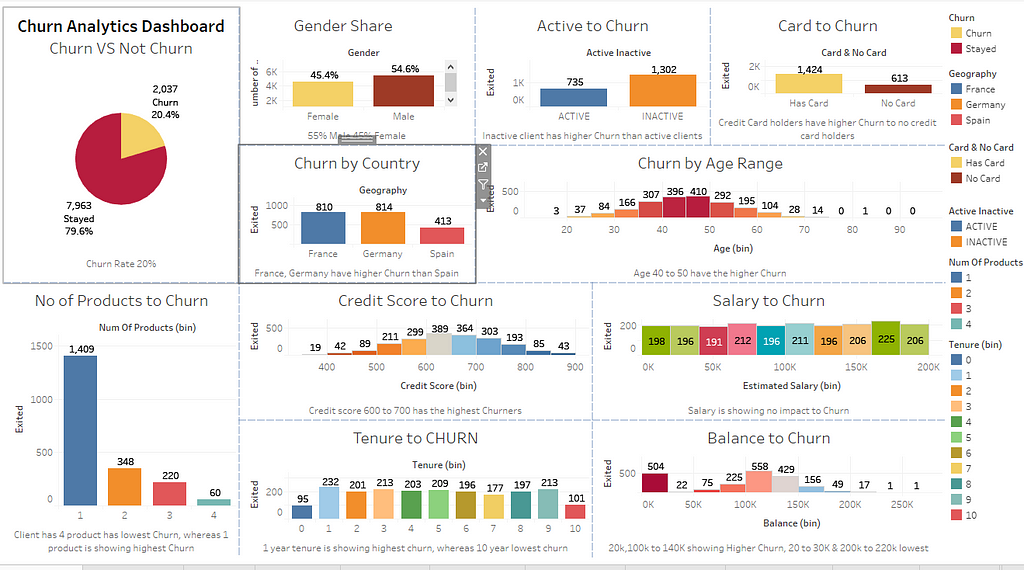
Dashboard:
The dashboard shows overall presentation/summary of the features influencing the attrition rate, some of the most influential features which affecting the churn are number of products, credit card, inactive, country, credit score, balance, Gender, age range
The link to the public interactive dashboard
https://public.tableau.com/profile/tests#!/vizhome/ProductsVSCHURN/ChurnAnalyticsDashboard
Model Building
Training the model
Training set uses 80% of the data, rest for test set
Testing the model
20% of the data is used for test set
Prediction using Machine Learning
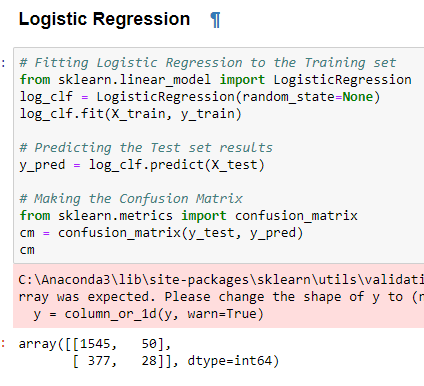
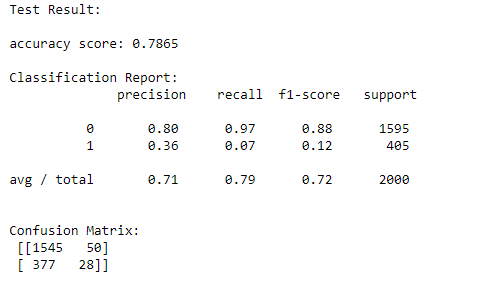
Logistic Regression
It is a classification algorithm that is used to predicting the probability of a categorical dependent variable in Machine Learning. In logistic regression, the dependent variable is a binary variable that contains data coded as 1 (yes, churn) or 0 (no Churn.). In other words, the logistic regression model predicts P(Y=1) as a function of X.
We are trying to predict whether the clients are like to leave or stay, the outcome is binary. here the logistic algorithm statistically analyzing the features to determine whether a client will churn or not
Here is the application of the algorithm
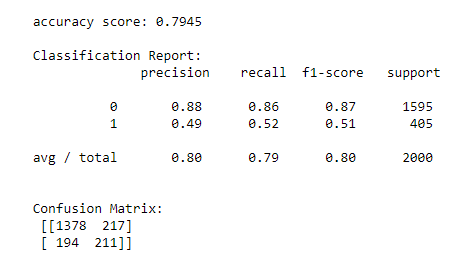
DecisionTree
Decision Trees (DTs) are a non-parametric supervised learning method used for classification and regression. The goal is to create a model that predicts the value of a target variable by learning simple decision rules inferred from the data features.
Here the decision tree representing boolean function (Y/N) as binary whether the client will churn or not
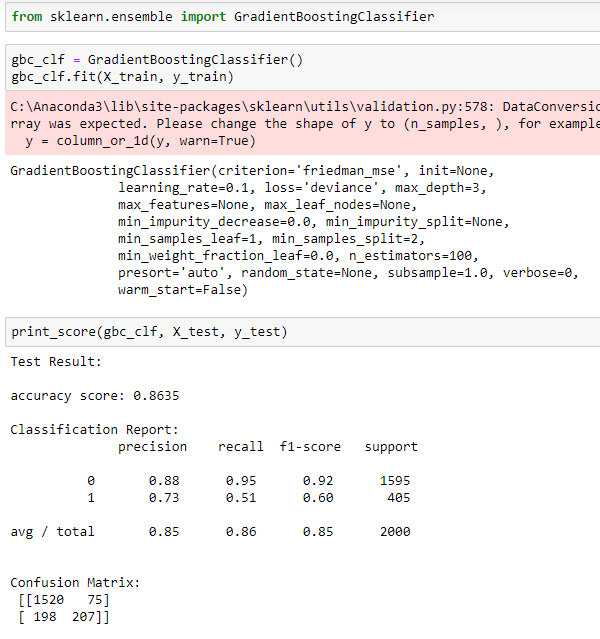
Gradient Boosting | Gradient Boosting Machine (GBM)
Here Gradient boosting classifying the outcome to whether a client will churn or not, it is a predictive model in the form of an ensemble uses decision trees.
Model Performance:
Modeling was applied on multiple machine learning algorithms with fine-tuning, here are some of the outcome of the model in terms of accuracy scores
•Logistic Regression 78.65%
•Decision Tree 79.45%
•Random Forest 84.85%
•SVM accuracy 79.80%
•Gradient Boosting 86.35%
•AdaBoost 86.35%
The algorithms gave the higher accuracy score are Gradient Boosting, AdaBoost compared to Decision Tree & Logistic regression
Further Reading:
- The data set: from Kaggle
- The Dashboard: tableau public
- A Survey on Customer Churn Prediction using Machine Learning Techniques: The paper reviews the most popular machine learning algorithms used by researchers for churn predicting
- Decision Tree: algorithm
- Github: githib repo
- Linkedin: linkedin page