Creating neural time series models with Gluon Time Series
We are excited to announce the open source release of Gluon Time Series (GluonTS), a Python toolkit developed by Amazon scientists for building, evaluating, and comparing deep learning–based time series models. GluonTS is based on the Gluon interface to Apache MXNet and provides components that make building time series models simple and efficient.
In this post, I describe the key functionality of the toolkit and demonstrate how to apply GluonTS to a time series forecasting problem.
Time series modeling use cases
Time series, as the name suggests, are collections of data points that are indexed by time. Time series arise naturally in many different applications, typically by measuring the value of some underlying process at a fixed time interval.
For example, a retailer might calculate and store the number of units sold for each product at the end of each business day. For each product, this leads to a time series of daily sales. An electricity company might measure the amount of electricity consumed by each household in a fixed interval, such as every hour. This leads to a collection of time series of electricity consumption. AWS customers might use Amazon CloudWatch to record various metrics relating to their resources and services, leading to a collection of metrics time series.
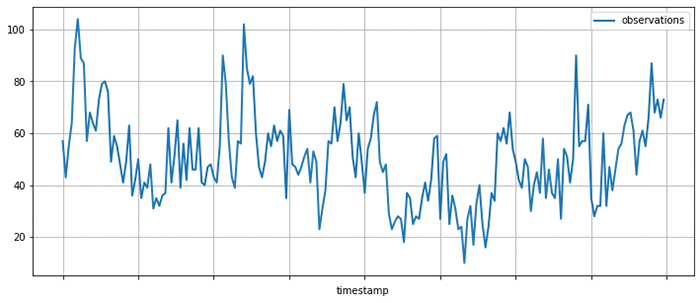
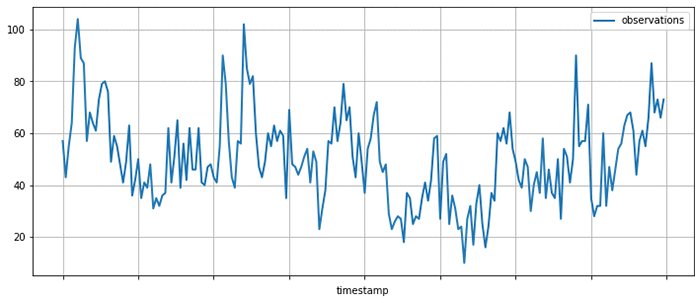
A typical time series may look like the following, where the measured amount is shown on the vertical axis and the horizontal axis is time:
Given a set of time series, you might ask various kinds of questions:
- How will the time series evolve in the future? Forecasting
- Is the behavior of the time series in a given period abnormal? Anomaly detection
- Which group does a given time series belong to? Time series classification
- Some measurements are missing, what were their values? Imputation
GluonTS allows you to address these questions by simplifying the process of building time series models, that is, mathematical descriptions of the process underlying the time series data. Numerous kinds of time series models have been proposed, and GluonTS focuses on a particular subset of these techniques based on deep learning.
GluonTS key functionality and components
GluonTS provides various components that make building deep learning-based, time series models simple and efficient. These models use many of the same building blocks as models that are used in other domains, such as natural language processing or computer vision.
Deep learning models for time series modeling commonly include components such as recurrent neural networks based on Long Short-Term Memory (LSTM) cells, convolutions, and attention mechanisms. This makes using a modern deep-learning framework, such as Apache MXNet, a convenient basis for developing and experimenting with such models.
However, time series modeling also often requires components that are specific to this application domain. GluonTS provides these time series modeling-specific components on top of the Gluon interface to MXNet. In particular, GluonTS contains:
- Higher-level components for building new models, including generic neural network structures like sequence-to-sequence models and components for modeling and transforming probability distributions
- Data loading and iterators for time series data, including a mechanism for transforming the data before it is supplied to the model
- Reference implementations of several state-of-the-art neural forecasting models
- Tooling for evaluating and comparing forecasting models
Most of the building blocks in GluonTS can be used for any of the time series modeling use cases mentioned earlier, while the model implementations and some of the surrounding tooling are currently focused on the forecasting use case.
GluonTS for time series forecasting
To make things more concrete, look at how to use one of time series models that comes bundled in GluonTS, for making forecasts on a real-world time series dataset.
For this example, use the DeepAREstimator, which implements the DeepAR model proposed in the DeepAR: Probabilistic Forecasting with Autoregressive Recurrent Networks paper. Given one or more time series, the model is trained to predict the next prediction_length values given the preceding context_length values. Instead of predicting single best values for each position in the prediction range, the model parametrizes a parametric probability distribution for each output position.
To encapsulate models and trained model artifacts, GluonTS uses an Estimator/Predictor pair of abstractions that should be familiar to users of other machine learning frameworks. An Estimator represents a model that can be trained on a dataset to yield a Predictor, which can later be used to make predictions on unseen data.
Instantiate a DeepAREstimator object by providing a few hyperparameters:
- The time series frequency (for this example, I use 5 minutes, so
freq="5min") - The prediction length (36 time points, which makes it span 3 hours)
You can also provide a Trainer object that can be used to configure the details of the training process. You could configure more aspects of the model by providing more hyperparameters as arguments, but stick with the default values for now, which usually provide a good starting point.
Model training on a real dataset
Having specified the Estimator, you are now ready to train the model on some data. Use a freely available dataset on the volume of tweets mentioning the AMZN ticker symbol. This can be obtained and displayed using Pandas, as follows:
GluonTS provides a Dataset abstraction for providing uniform access to data across different input formats. Here, use ListDataset to access data stored in memory as a list of dictionaries. In GluonTS, any Dataset is just an Iterable over dictionaries mapping string keys to arbitrary values.
To train your model, truncate the data up to April 5, 2015. Data past this date is used later for testing the model.
With the dataset in hand, you can now use your estimator and call its train method. When the training process is finished, you have a Predictor that can be used for making forecasts.
Model evaluation
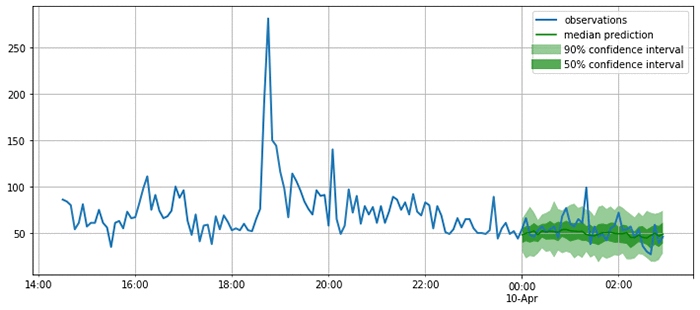
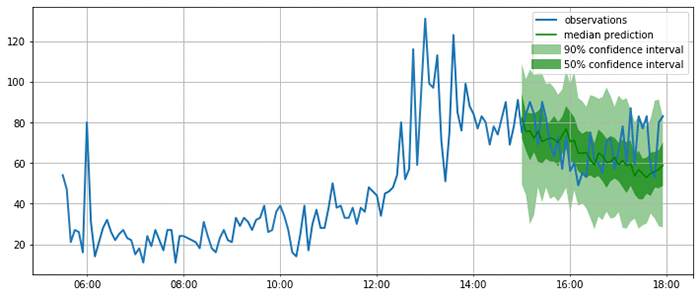
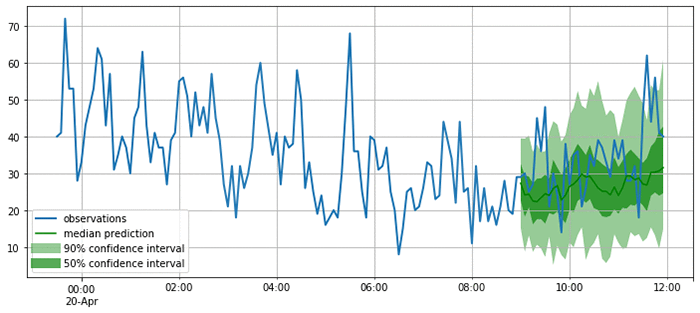
Now use the predictor to plot the model’s forecasts on a few time ranges that start after the last time point seen during training. This is useful for getting a qualitative feel for the quality of the outputs produced by this model.
Using the same base dataset as before, create a few test instances by taking data past the time range previously used for training.
As you can see from the following plots, the model produces probabilistic predictions. This is important because it provides an estimate of how confident the model is, and allows downstream decisions based on these forecasts to account for this uncertainty.
Now that you are satisfied that the forecasts look reasonable, you can compute a quantitative evaluation of the forecasts for all the time series in the test set using a variety of metrics. GluonTS provides an Evaluator component, which performs this model evaluation. It produces some commonly used error metrics such as MSE, MASE, symmetric MAPE, RMSE, and (weighted) quantile losses.
You can now compare these metrics against those produced by other models, or to the business requirements for your forecasting application. For example, you can produce forecasts using the seasonal naive method. This model assumes that the data has a fixed seasonality (in this case, 2016 time steps correspond to a week), and produces forecasts by copying past observations based on it.
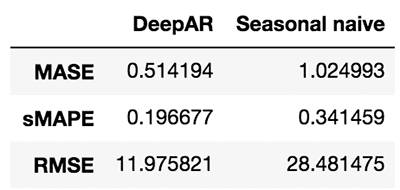
By looking at these metrics, you can get an idea of how your model compares to baselines or other advanced models. To improve the results, tweak the architecture or the hyperparameters.
Help make GluonTS better!
In this post, I only touched on a small subset of functionality provided by GluonTS. If you would like to dive deeper, I encourage you to check out tutorials and further examples.
GluonTS is open source under the Apache license. We welcome and encourage contributions from the community as bug reports and pull requests. Head over to the GluonTS GitHub repo now!
About the Authors
 Jan Gasthaus is a Senior Machine Learning Scientist with AWS AI Labs where his passion is designing machine learning models, algorithms, and systems, and deploying them at scale.
 Lorenzo Stella is an Applied Scientist on the AWS AI Labs team. His research interests are in machine learning and optimization. He has worked on probabilistic and deep models for forecasting.
 Tim Januschowski is a Machine Learning Science Manager at AWS AI Labs. He has worked on forecasting and has produced end-to-end solutions for a wide variety of forecasting problems, from demand forecasting to server capacity forecasting over the course of his tenure at Amazon.
 Richard Lee is a Product Manager at AWS AI Labs. He is passionate about how Artificial Intelligence impacts the worlds around us, and is on a mission to make it accessible to all. He is also a pilot, science and nature admirer, and beginner cook.
 Syama Sundar Rangapuram is a Machine Learning Scientist at AWS AI Labs. His research interests are in machine learning and optimization. In forecasting, he has worked on probabilistic models and data-driven models in particular for the cold-start problem.
 Konstantinos Benidis is an Applied Scientist at AWS AI Labs. His research interests are in machine learning, optimization and financial engineering. He has worked on probabilistic and deep models for forecasting.
 Alexander Alexandrov is a Post-Doc on the AWS AI Labs team and TU-Berlin. He is passionate about scalable data management, data analytics applications, and optimizing DSLs.
 David Salinas is a Senior Applied Scientist in the AWS AI Labs team. He is working on applying deep-learning to various application such as forecasting or NLP.
 Danielle Robinson is an Applied Scientist in the AWS AI Labs team. She is working on combining deep learning methods with classical statiscal methods for forecasting. Her interests also include numerical linear algebra, numerical optimization and numerical PDEs.
 Yuyang (Bernie) Wang is a Senior Machine Learning Scientist in Amazon AI Labs, working mainly on large-scale probabilistic machine learning with its application in Forecasting. His research interests span statistical machine learning, numerical linear algebra, and random matrix theory. In forecasting, Yuyang has worked on all aspects ranging from practical applications to theoretical foundations.
 Valentin Flunkert is a Senior Machine Learning Scientist at AWS AI Labs. He is passionate about building machine learning systems for solving business problems. He has worked on a variety of machine learning and forecasting problems at Amazon.
 Michael Bohlke-Schneider is a Data Scientist in AWS AI Labs/Fulfillment Technology, researching and developing forecasting algorithms in SageMaker and applying forecasting to business problems.
 Jasper Schulz is a software development engineer in the AWS AI Labs team.