Deepneural networks (DNN) are the cornerstone of recent progress in machine learning, and are responsible for recent breakthroughs in a variety of tasks such as image recognition, image segmentation, machine translation and more. However, despite their ubiquity, researchers are still attempting to fully understand the underlying principles that govern them. In particular, classical theories (e.g., VC-dimension and Rademacher complexity) suggest that over-parameterized functions should generalize poorly to unseen data, yet recent work has found that massively over-parameterized functions (orders of magnitude more parameters than the number of data points) generalize well. In order to improve models, a better understanding of generalization, which can lead to more theoretically grounded and therefore more principled approaches to DNN design, is required.
An important concept for understanding generalization is the generalization gap, i.e., the difference between a model’s performance on training data and its performance on unseen data drawn from the same distribution. Significant strides have been made towards deriving better DNN generalization bounds—the upper limit to the generalization gap—but they still tend to greatly overestimate the actual generalization gap, rendering them uninformative as to why some models generalize so well. On the other hand, the notion of margin—the distance between a data point and the decision boundary—has been extensively studied in the context of shallow models such as support-vector machines, and is found to be closely related to how well these models generalize to unseen data. Because of this, the use of margin to study generalization performance has been extended to DNNs, resulting in highly refined theoretical upper bounds on the generalization gap, but has not significantly improved the ability to predict how well a model generalizes.
An example of a support-vector machine decision boundary. The hyperplane defined by w∙x-b=0 is the “decision boundary” of this linear classifier, i.e., every point x lying on the hyperplane is equally likely to be in either class under this classifier.
In our ICLR 2019 paper, “Predicting the Generalization Gap in Deep Networks with Margin Distributions”, we propose the use of a normalized margin distribution across network layers as a predictor of the generalization gap. We empirically study the relationship between the margin distribution and generalization and show that, after proper normalization of the distances, some basic statistics of the margin distributions can accurately predict the generalization gap. We also make available all the models used as a dataset for studying generalization through the Github repository.
Each plot corresponds to a convolutional neural network trained on CIFAR-10 with different classification accuracies. The probability density (y-axis) of normalized margin distributions (x-axis) at 4 layers of a network is shown for three different models with increasingly better generalization (left to right). The normalized margin distributions are strongly correlated with test accuracy, which suggests they can be used as a proxy for predicting a network’s generalization gap. Please see our paper for more details on these networks.
Margin Distributions as a Predictor of Generalization Intuitively, if the statistics of the margin distribution are truly predictive of the generalization performance, a simple prediction scheme should be able to establish the relationship. As such, we chose linear regression to be the predictor. We found that the relationship between the generalization gap and the log-transformed statistics of the margin distributions is almost perfectly linear (see figure below). In fact, the proposed scheme produces better prediction relative to other existing measures of generalization. This indicates that the margin distributions may contain important information about how deep models generalize.
Predicted generalization gap (x-axis) vs. true generalization gap (y-axis) on CIFAR-100 + ResNet-32. The points lie close to the diagonal line, which indicates that the predicted values of the log linear model fit the true generalization gap very well.
The Deep Model Generalization Dataset In addition to our paper, we are introducing the Deep Model Generalization (DEMOGEN) dataset, which consists of of 756 trained deep models, along with their training and test performance on the CIFAR-10 and CIFAR-100 datasets. The models are variants of CNNs (with architectures that resemble Network-in-Network) and ResNet-32 with different popular regularization techniques and hyperparameter settings, inducing a wide spectrum of generalization behaviors. For example, the models of CNNs trained on CIFAR-10 have the test accuracies ranging from 60% to 90.5% with generalization gaps ranging from 1% to 35%. For details of the dataset, please see our paper or the Github repository. As part of the dataset release, we also include utilities to easily load the models and reproduce the results presented in our paper.
We hope that this research and the DEMOGEN dataset will provide the community with an accessible tool for studying generalization in deep learning without having to retrain a large number of models. We also hope that our findings will motivate further research in generalization gap predictors and margin distributions in the hidden layers.
Just wanted to share a little project we’re working on: Architecture ex Machina. The target audience is maybe a little less technical than the folks in this community in that we’re hoping to get involvement from people without a CS background, namely: architects, designers, and other practitioners in the architecture/engineering/construction industry.
We’ve got some additional background and details about the work in this post:
We’re also working on a site in the style of This Person Does Not Exist to demonstrate the potential of StyleGAN with buildings and would be happy to have additional contributors:
Hey everyone, not sure if this qualifies as “project” on here, but some people writing ML papers might find it useful. I’m currently writing my MSc Artificial Intelligence thesis (on transfer learning for credit card fraud prediction ML models).
When I’m citing a paper for my thesis, it takes half a second to grab the BibTeX entry for it from Google Scholar. For Python packages like numpy, scikit-learn, scipy, pandas, tensorflow and pytorch, it took a lot more Googling and it was sometimes difficult to figure out what version to use.
So I’ve started a repo to collect some common Python machine learning package citations, to make it easier to quickly copy-paste them into a references.bib.
I feel like this might be a stupid question, but I’ve been doing some research and while I understand the design of convolutional neural networks, I’m having trouble understanding how they work for classifying multiple types of objects.
From what I know, CNNs work by adjusting their filters to be able to recognize an object. However, if there is more than one type of object that the filters need to be adjusted for, how is this done? Is it that we simply add more neurons to each layer to account for additional object filters? Or are the learned filters in a sense “averaged” across the types of images?
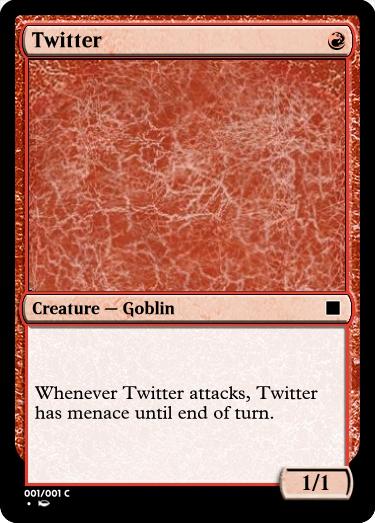
Even with only a little training and data augmentation, GPT-2 117M overfits on Magic cards, which leads to some interesting remixes of existing cards, and some cards with interesting value. Some examples:
The code for the text generation API is open-sourced here, and the code for the image generation API (which uses an ugly wine hack) is open sourced here.
Other helpful notes:
To share the generated card image, you can Save As the generated card locally, and to use it elsewhere, rename it and add a .jpg file extension.
The network can recite existing card names and rules text of existing cards, but rarely to the same card. The network often makes interesting color shift decisions with changes to CMC/Rarity.
In terms of color accuracy, color pie is mostly correct. Creature types and mechanics often follow the appropriate color identity. P/T, mana cost, and rarity are balanced.
The card formatting issues are due to the underlying mtgencode/MSE implementations and are not easy to fix (most notable with Planeswalker cards).
The concept TF-IDF stands for term frequency-inverse document frequency. This is in the field of numerical statistics. With this concept, we will be able to decide how important a word is to a given document in the present dataset or corpus.
Frequency
What is TF-IDF?
TF-IDF indicates what the importance of the word is in order to understand the document or dataset. Let us understand with an example. Suppose you have a dataset where students write an essay on the topic, My House. In this dataset, the word a appears many times; it’s a high frequency word compared to other words in the dataset. The dataset contains other words like home, house, rooms and so on that appear less often, so their frequency are lower and they carry more information compared to the word. This is the intuition behind TF-IDF.
Let us dive deep into the mathematical aspect of TF-IDF. It has two parts: Term Frequency(TF) and Inverse Document Frequency(IDF). The term frequency indicates the frequency of each of the words present in the document or dataset.
So, its equation is given as follows:
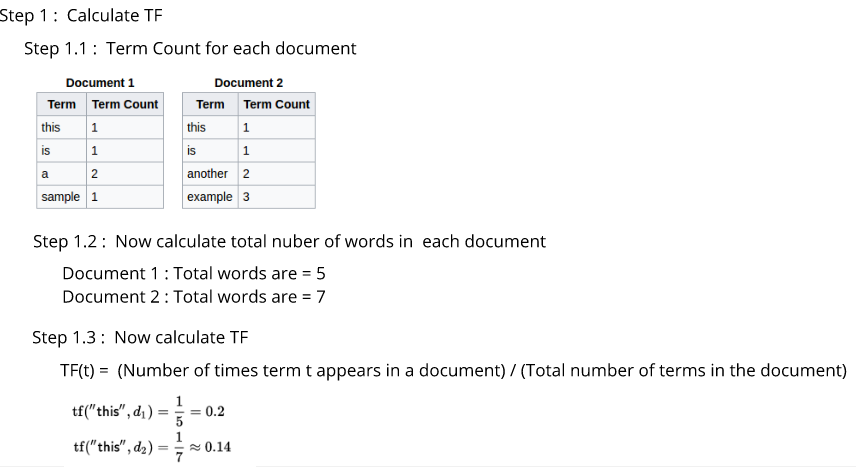
TF(t) = (Number of times term t appears in a document) / (Total number of terms in the document)
The second part is — inverse document frequency. IDF actually tells us how important the word is to the document. This is because when we calculate TF, we give equal importance to every single word. If the word appears in the dataset more frequently, then its term frequency (TF) value is high while not being that important to the document.
So, if the word the appears in the document 100 times, then it’s not carrying that much information compared to words that are less frequent in the dataset. Thus, we need to define some weighing down of the frequent terms while scaling up the rare ones, which decides the importance of each word. We will achieve this with the following equation:
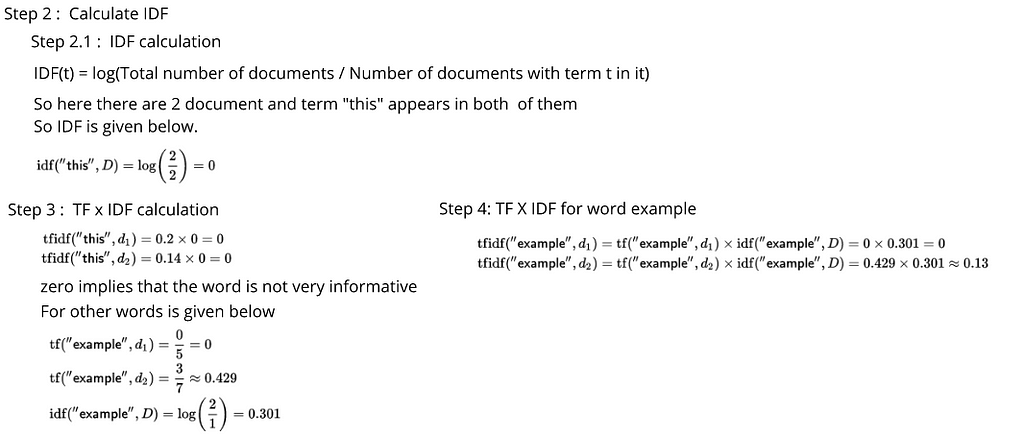
IDF(t) = log10(Total number of documents / Number of documents with term t in it).
Hence, equation is calculate TF-IDF is as follows.
TF * IDF = [ (Number of times term t appears in a document) / (Total number of terms in the document) ] * log10(Total number of documents / Number of documents with term t in it).
In reality, TF-IDF is the multiplication of TF and IDF, such as TF * IDF.
Now, let’s take an example where you have two sentences and are considering those sentences as different documents in order to understand the concept of TF-IDF:
Thanks for reading! 😊 If you enjoyed it, test how many times can you hit 👏 in 5 seconds. It’s great cardio for your fingers AND will help other people see the story.
Hello. I have a model in XGBoost and as a way of making little improvements, I have been testing the introduction of new variables in the following way:
-Make a k-fold CrossValidation process with a new variable (now onwards X), so that I get k values of a, for instance, recall (or any other metric, F1-score, F2, whatever), stored in X_list.
-Drop the variable X and make a k-fold cross validation process, ending with another list of k recall values, called Y_list.
-Make a hypothesis test to compare recall of first sample (X_list) against second sample (Y_list).
-If the hypothesis test says that X_list have greater recall than Y_list, I take X as a useful feature and I keep it.
Is there any error in the reasoning of this part? Anything to improve?
If I want to test another variable, I keep X and I introduce the variable Z and make the same process. In the case that the test gives Z as useful, I also keep it. Let’s imagine that I also introduce the variable W. Until now, I have been keeping both X,Z and W as new variables, but I have a doubt:
Having improvements with X,Z and W in the way I had them, means that that is the best combination of variables? Or maybe if I had tested W right after X, W or Z wouldn’t have throw better results? Should I test every possible combination among those 3 variables or it is okay the way I am doing it?
Google Maps introduced live traffic delays for buses, forecasting bus delays in hundreds of cities world-wide, ranging from Atlanta to Zagreb to Istanbul to Manila and more. This improves the accuracy of transit timing for over sixty million people. This system, first launched in India three weeks ago, is driven by a machine learning model that combines real-time car traffic forecasts with data on bus routes and stops to better predict how long a bus trip will take.
I’m trying to wrap my head around this paper https://arxiv.org/abs/1805.11783 and albeit I have an ok understanding of Topology (undergrad level I would say), a lot of what is in that paper goes over my head.
What are good prerequisites to read a paper like that? Any resources? Any good books on topological learning/ topological data analysis?