Posted by Alex Fabrikant, Research Scientist, Google Research
Hundreds of millions of people across the world rely on public transit for their daily commute, and over half of the world’s transit trips involve buses. As the world’s cities continue growing, commuters want to know when to expect delays, especially for bus rides, which are prone to getting held up by traffic. While public transit directions provided by Google Maps are informed by many transit agencies that provide real-time data, there are many agencies that can’t provide them due to technical and resource constraints.
Today, Google Maps introduced live traffic delays for buses, forecasting bus delays in hundreds of cities world-wide, ranging from Atlanta to Zagreb to Istanbul to Manila and more. This improves the accuracy of transit timing for over sixty million people. This system, first launched in India three weeks ago, is driven by a machine learning model that combines real-time car traffic forecasts with data on bus routes and stops to better predict how long a bus trip will take.
The Beginnings of a Model
In the many cities without real-time forecasts from the transit agency, we heard from surveyed users that they employed a clever workaround to roughly estimate bus delays: using Google Maps driving directions. But buses are not just large cars. They stop at bus stops; take longer to accelerate, slow down, and turn; and sometimes even have special road privileges, like bus-only lanes.
As an example, let’s examine a Wednesday afternoon bus ride in Sydney. The actual motion of the bus (blue) is running a few minutes behind the published schedule (black). Car traffic speeds (red) do affect the bus, such as the slowdown at 2000 meters, but a long stop at the 800 meter mark slows the bus down significantly compared to a car.
To develop our model, we extracted training data from sequences of bus positions over time, as received from transit agencies’ real time feeds, and aligned them to car traffic speeds on the bus’s path during the trip. The model is split into a sequence of timeline units—visits to street blocks and stops—each corresponding to a piece of the bus’s timeline, with each unit forecasting a duration. A pair of adjacent observations usually spans many units, due to infrequent reporting, fast-moving buses, and short blocks and stops.
This structure is well suited for neural sequence models like those that have recently been successfully applied to speech processing, machine translation, etc. Our model is simpler. Each unit predicts its duration independently, and the final output is the sum of the per-unit forecasts. Unlike many sequence models, our model does not need to learn to combine unit outputs, nor to pass state through the unit sequence. Instead, the sequence structure lets us jointly (1) train models of individual units’ durations and (2) optimize the “linear system” where each observed trajectory assigns a total duration to the sum of the many units it spans.
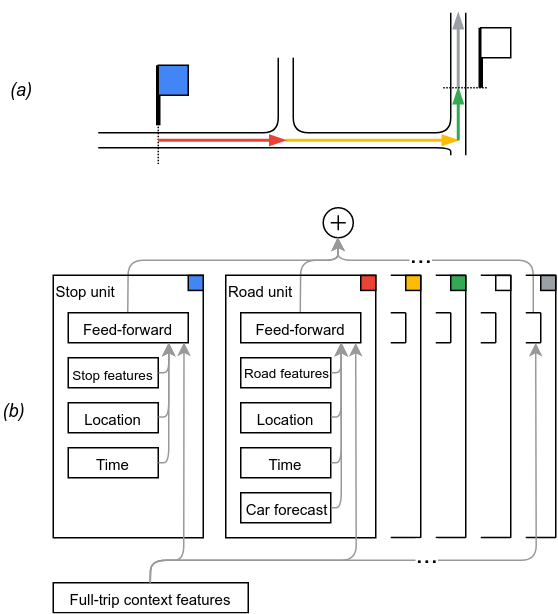 |
| To model a bus trip (a) starting at the blue stop, the model (b) adds up the delay predictions from timeline units for the blue stop, the three road segments, the white stop, etc. |
Modeling the “Where”
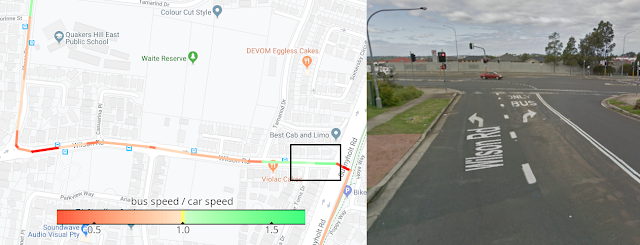
In addition to road traffic delays, in training our model we also take into account details about the bus route, as well as signals about the trip’s location and timing. Even within a small neighborhood, the model needs to translate car speed predictions into bus speeds differently on different streets. In the left panel below, we color-code our model’s predicted ratio between car speeds and bus speeds for a bus trip. Redder, slower parts may correspond to bus deceleration near stops. As for the fast green stretch in the highlighted box, we learn from looking at it in StreetView (right) that our model discovered a bus-only turn lane. By the way, this route is in Australia, where right turns are slower than left, another aspect that would be lost on a model that doesn’t consider peculiarities of location.
To capture unique properties of specific streets, neighborhoods, and cities, we let the model learn a hierarchy of representations for areas of different size, with a timeline unit’s geography (the precise location of a road or a stop) represented in the model by the sum of the embeddings of its location at various scales. We first train the model with progressively heavier penalties for finer-grain locations with special cases, and use the results for feature selection. This ensures that fine-grained features in areas complex enough where a hundred meters affects bus behavior are taken into account, as opposed to open countryside where such fine-grained features seldom matter.
At training time, we also simulate the possibility of later queries about areas that were not in the training data. In each training batch, we take a random slice of examples and discard geographic features below a scale randomly selected for each. Some examples are kept with the exact bus route and street, others keep only neighborhood- or city-level locations, and others yet have no geographical context at all. This better prepares the model for later queries about areas where we were short on training data. We expand the coverage of our training corpus by using anonymized inferences about user bus trips from the same dataset that Google Maps uses for popular times at businesses, parking difficulty, and other features. However, even this data does not include the majority of the world’s bus routes, so our models must generalize robustly to new areas.
Learning the Local Rhythms
Different cities and neighborhoods also run to a different beat, so we allow the model to combine its representation of location with time signals. Buses have a complex dependence on time — the difference between 6:30pm and 6:45pm on a Tuesday might be the wind-down of rush hour in some neighborhoods, a busy dining time in others, and entirely quiet in a sleepy town elsewhere. Our model learns an embedding of the local time of day and day of week signals, which, when combined with the location representation, captures salient local variations, like rush hour bus stop crowds, that aren’t observed via car traffic.
This embedding assigns 4-dimensional vectors to times of the day. Unlike most neural net internals, four dimensions is almost few enough to visualize, so let’s peek at how the model arranges times of day in three of those dimensions, via the artistic rendering below. The model indeed learns that time is cyclical, placing time in a “loop”. But this loop is not just the flat circle of a clock’s face. The model learns wide bends that let other neurons compose simple rules to easily separate away concepts like “middle of the night” or “late morning” that don’t feature much bus behavior variation. On the other hand, evening commute patterns differ much more among neighborhoods and cities, and the model appears to create more complex “crumpled” patterns between 4pm-9pm that enable more intricate inferences about the timings of each city’s rush hour.
 |
| The model’s time representation (3 out of 4 dimensions) forms a loop, reimagined here as the circumference of a watch. The more location-dependent time windows like 4pm-9pm and 7am-9am get more complex “crumpling”, while big featureless windows like 2am-5am get bent away with flat bends for simpler rules. (Artist’s conception by Will Cassella, using textures from textures.com and HDRIs from hdrihaven.) |
Together with other signals, this time representation lets us predict complex patterns even if we hold car speeds constant. On a 10km bus ride through New Jersey, for example, our model picks up on lunchtime crowds and weekday rush hours:
Putting it All Together
With the model fully trained, let’s take a look at what it learned about the Sydney bus ride above. If we run the model on that day’s car traffic data, it gives us the green predictions below. It doesn’t catch everything. For instance, it has the stop at 800 meters lasting only 10 seconds, though the bus stopped for at least 31 sec. But we stay within 1.5 minutes of the real bus motion, catching a lot more of the trip’s nuances than the schedule or car driving times alone would give us.
The Trip Ahead
One thing not in our model for now? The bus schedule itself. So far, in experiments with official agency bus schedules, they haven’t improved our forecasts significantly. In some cities, severe traffic fluctuations might overwhelm attempts to plan a schedule. In others, the bus schedules might be precise, but perhaps because transit agencies carefully account for traffic patterns. And we infer those from the data.
We continue to experiment with making better use of schedule constraints and many other signals to drive more precise forecasting and make it easier for our users to plan their trips. We hope we’ll be of use to you on your way, too. Happy travels!
Acknowledgements
This work was the joint effort of James Cook, Alex Fabrikant, Ivan Kuznetsov, and Fangzhou Xu, on Google Research, and Anthony Bertuca, Julian Gibbons, Thierry Le Boulengé, Cayden Meyer, Anatoli Plotnikov, and Ivan Volosyuk on Google Maps. We thank Senaka Buthpitiya, Da-Cheng Juan, Reuben Kan, Ramesh Nagarajan, Andrew Tomkins, and the greater Transit team for support and helpful discussions; as well as Will Cassella for the inspired reimagining of the model’s time embedding. We are also indebted to our partner agencies for providing the transit data feeds the system is trained on.

![Understanding model transferability [D]](https://b.thumbs.redditmedia.com/cgZvsNL6vcwo5Iy43mpLEueMIZg3SADuSCWnIr2Aq9k.jpg "Understanding model transferability [D]")